Regulatory Intelligence Transformed
At Redica, we used GPT-4o and a knowledge graph to turn fragmented pharma regulatory data into navigable intelligence. We built a system that connected guidance documents, inspection reports, enforcement actions, and CFRs. Users could explore relationships between regulatory activity across different agencies and topics. I worked with the team to use GPT-4o for extracting relationships, summarizing documents, translating non-English content, and surfacing connections that weren't obvious through keyword search. The system allowed users to chat with any document, automatically generate site risk briefings, and explore complex regulatory topics. This made it much easier to find relevant context and make informed decisions.
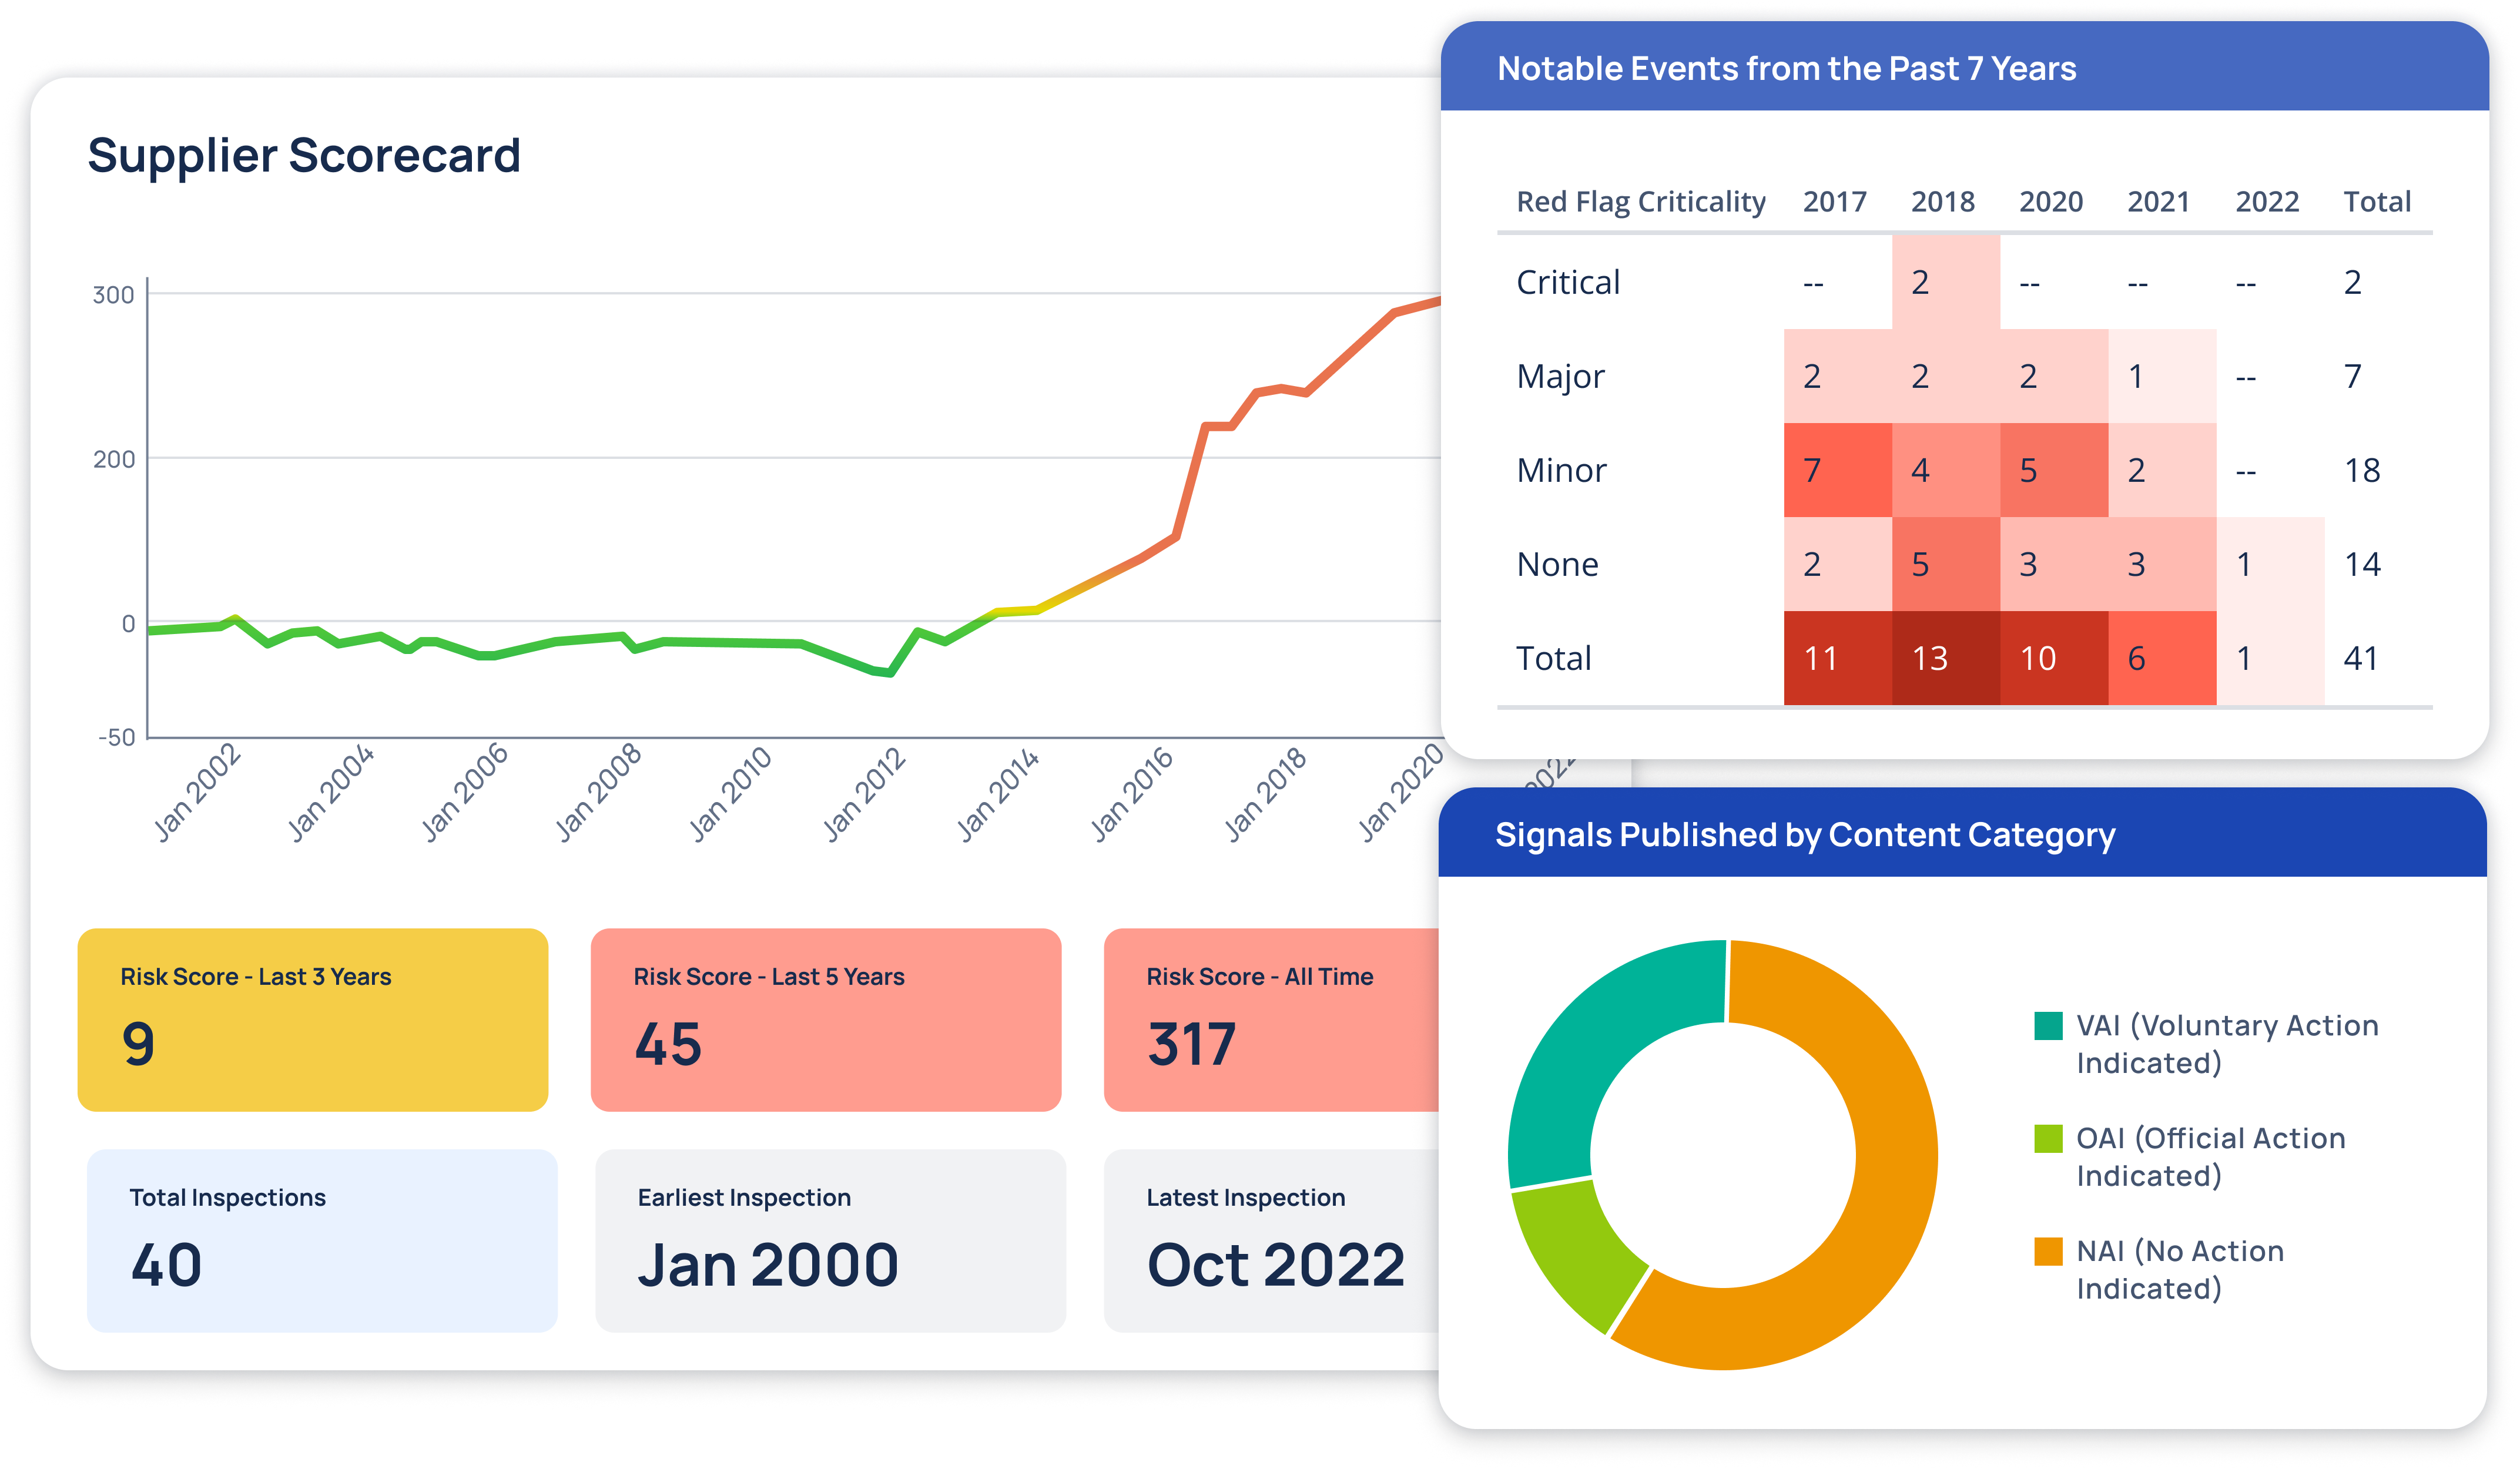
Supplier Risk Intelligence
Real-time tracking of regulatory events and risk patterns across pharmaceutical suppliers
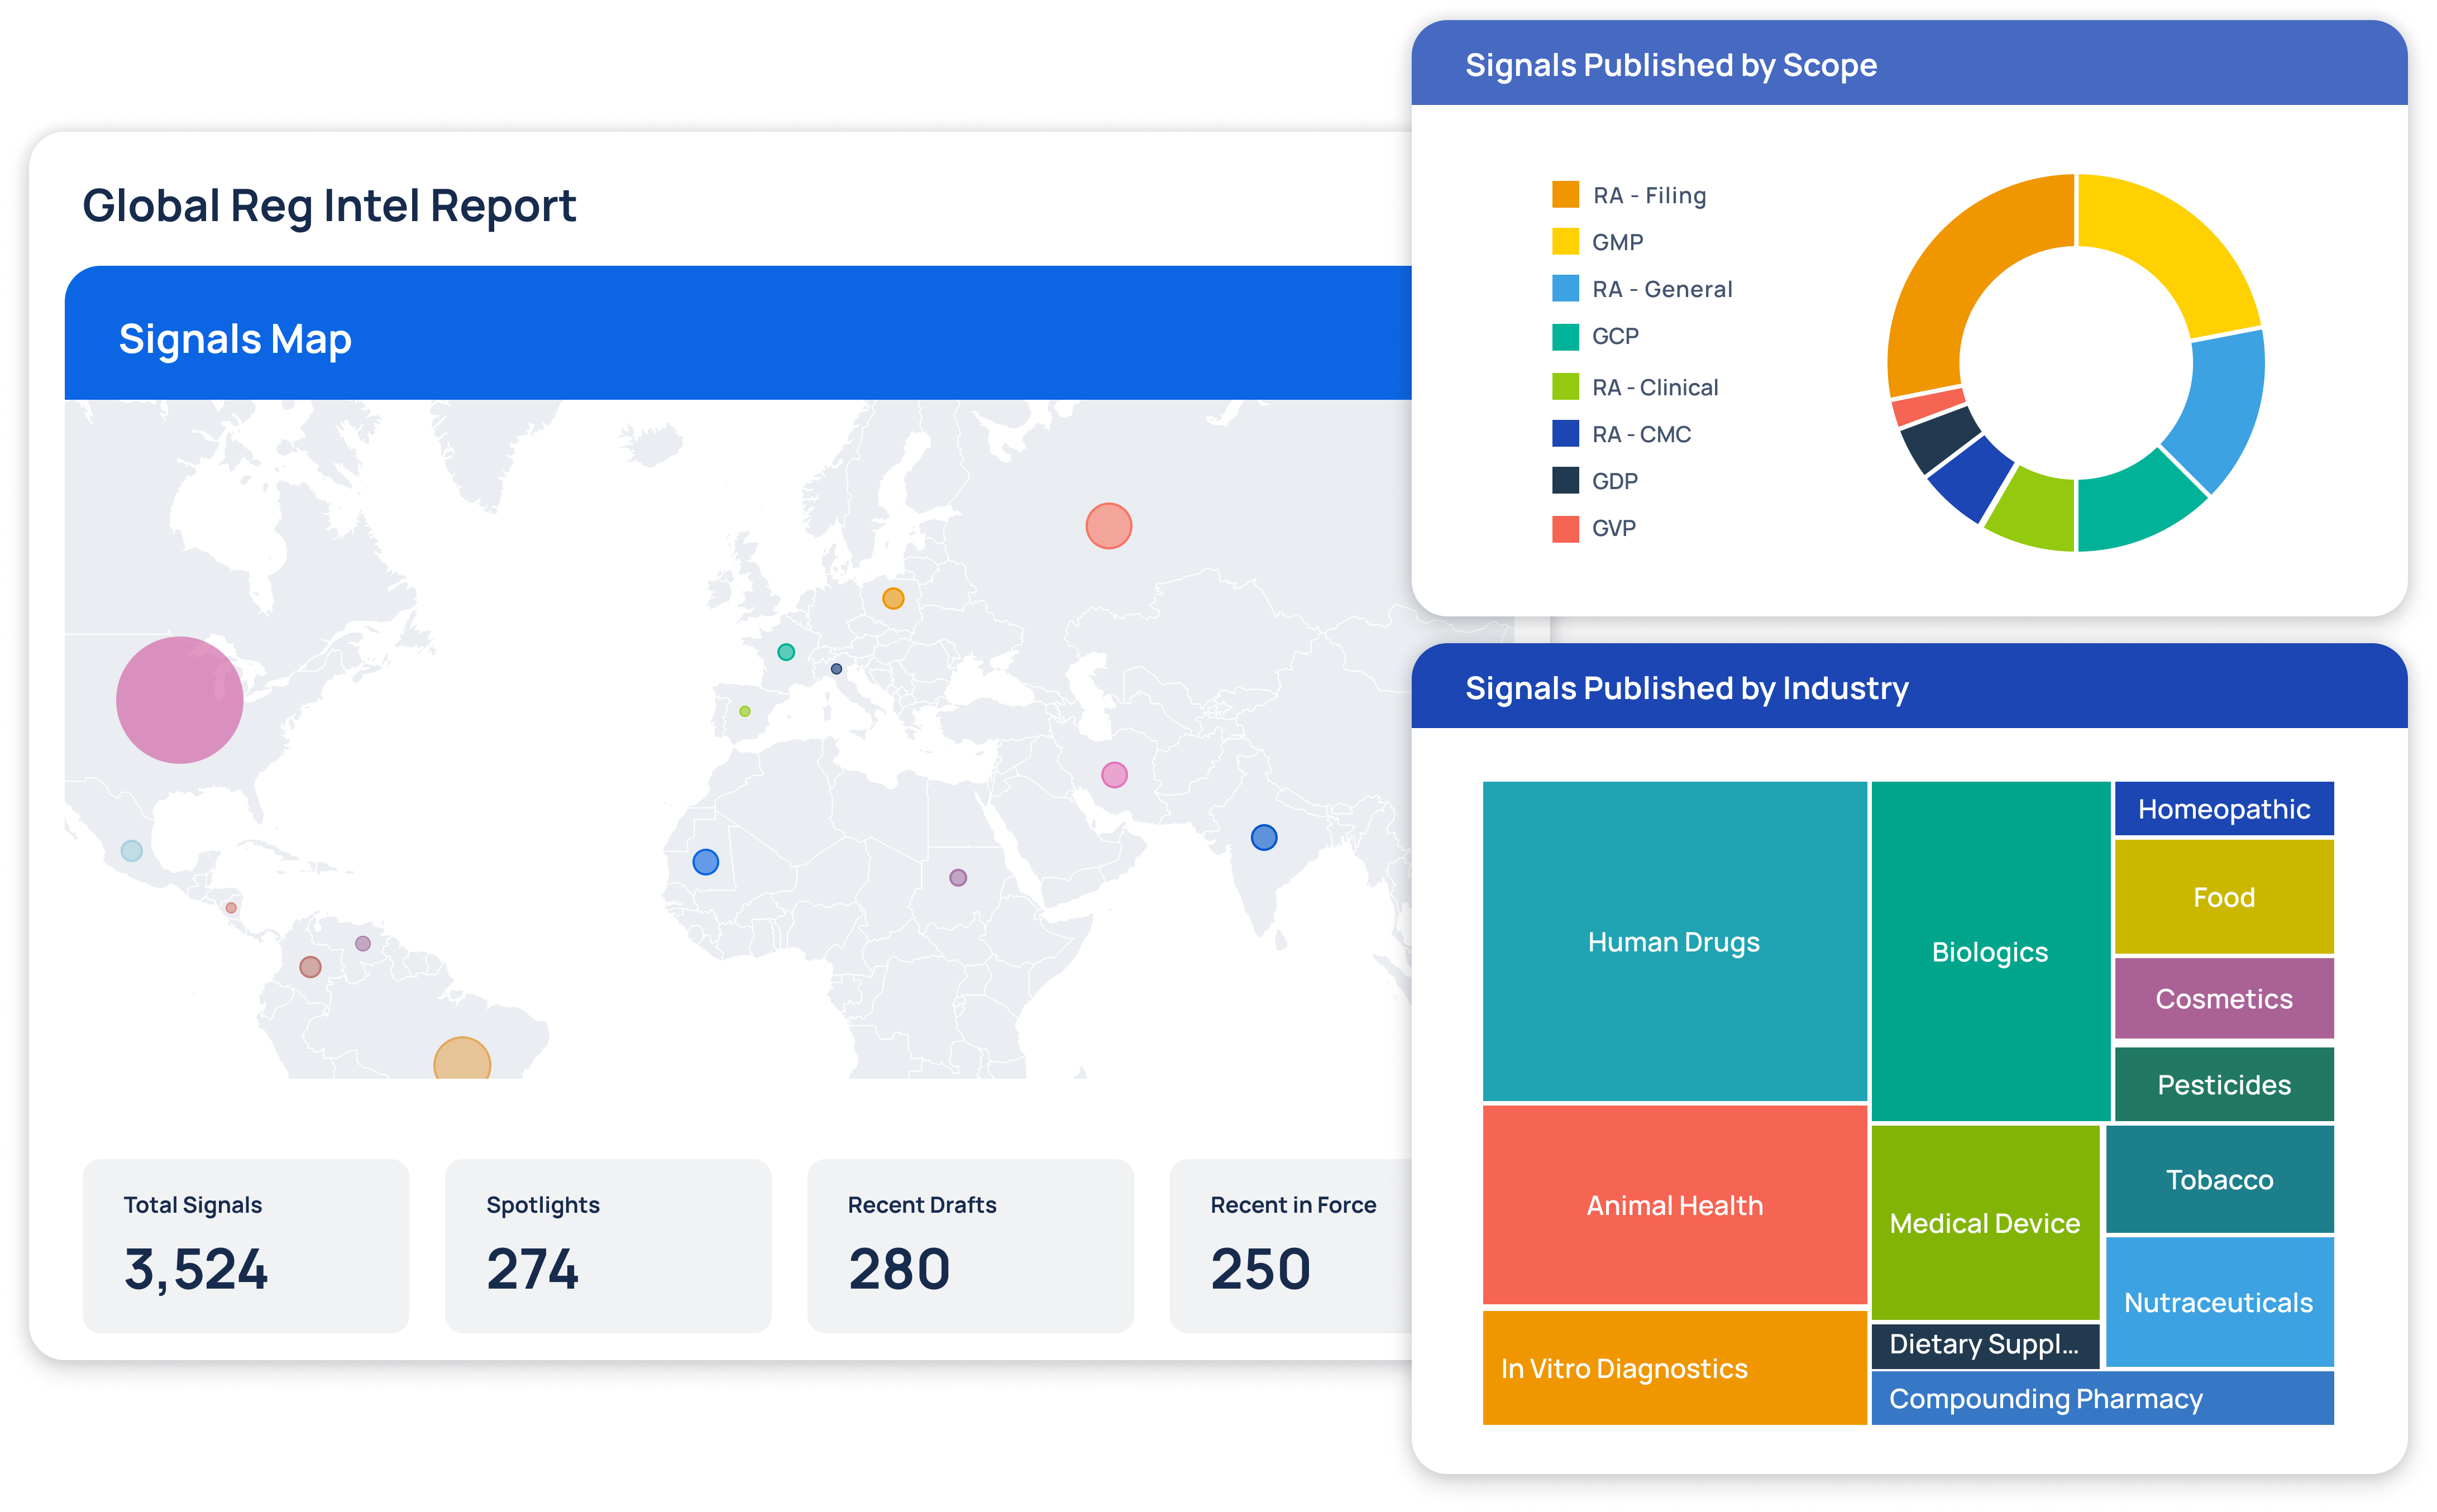
Global Regulatory Intelligence
Interactive mapping of regulatory signals across regions, industries, and compliance categories
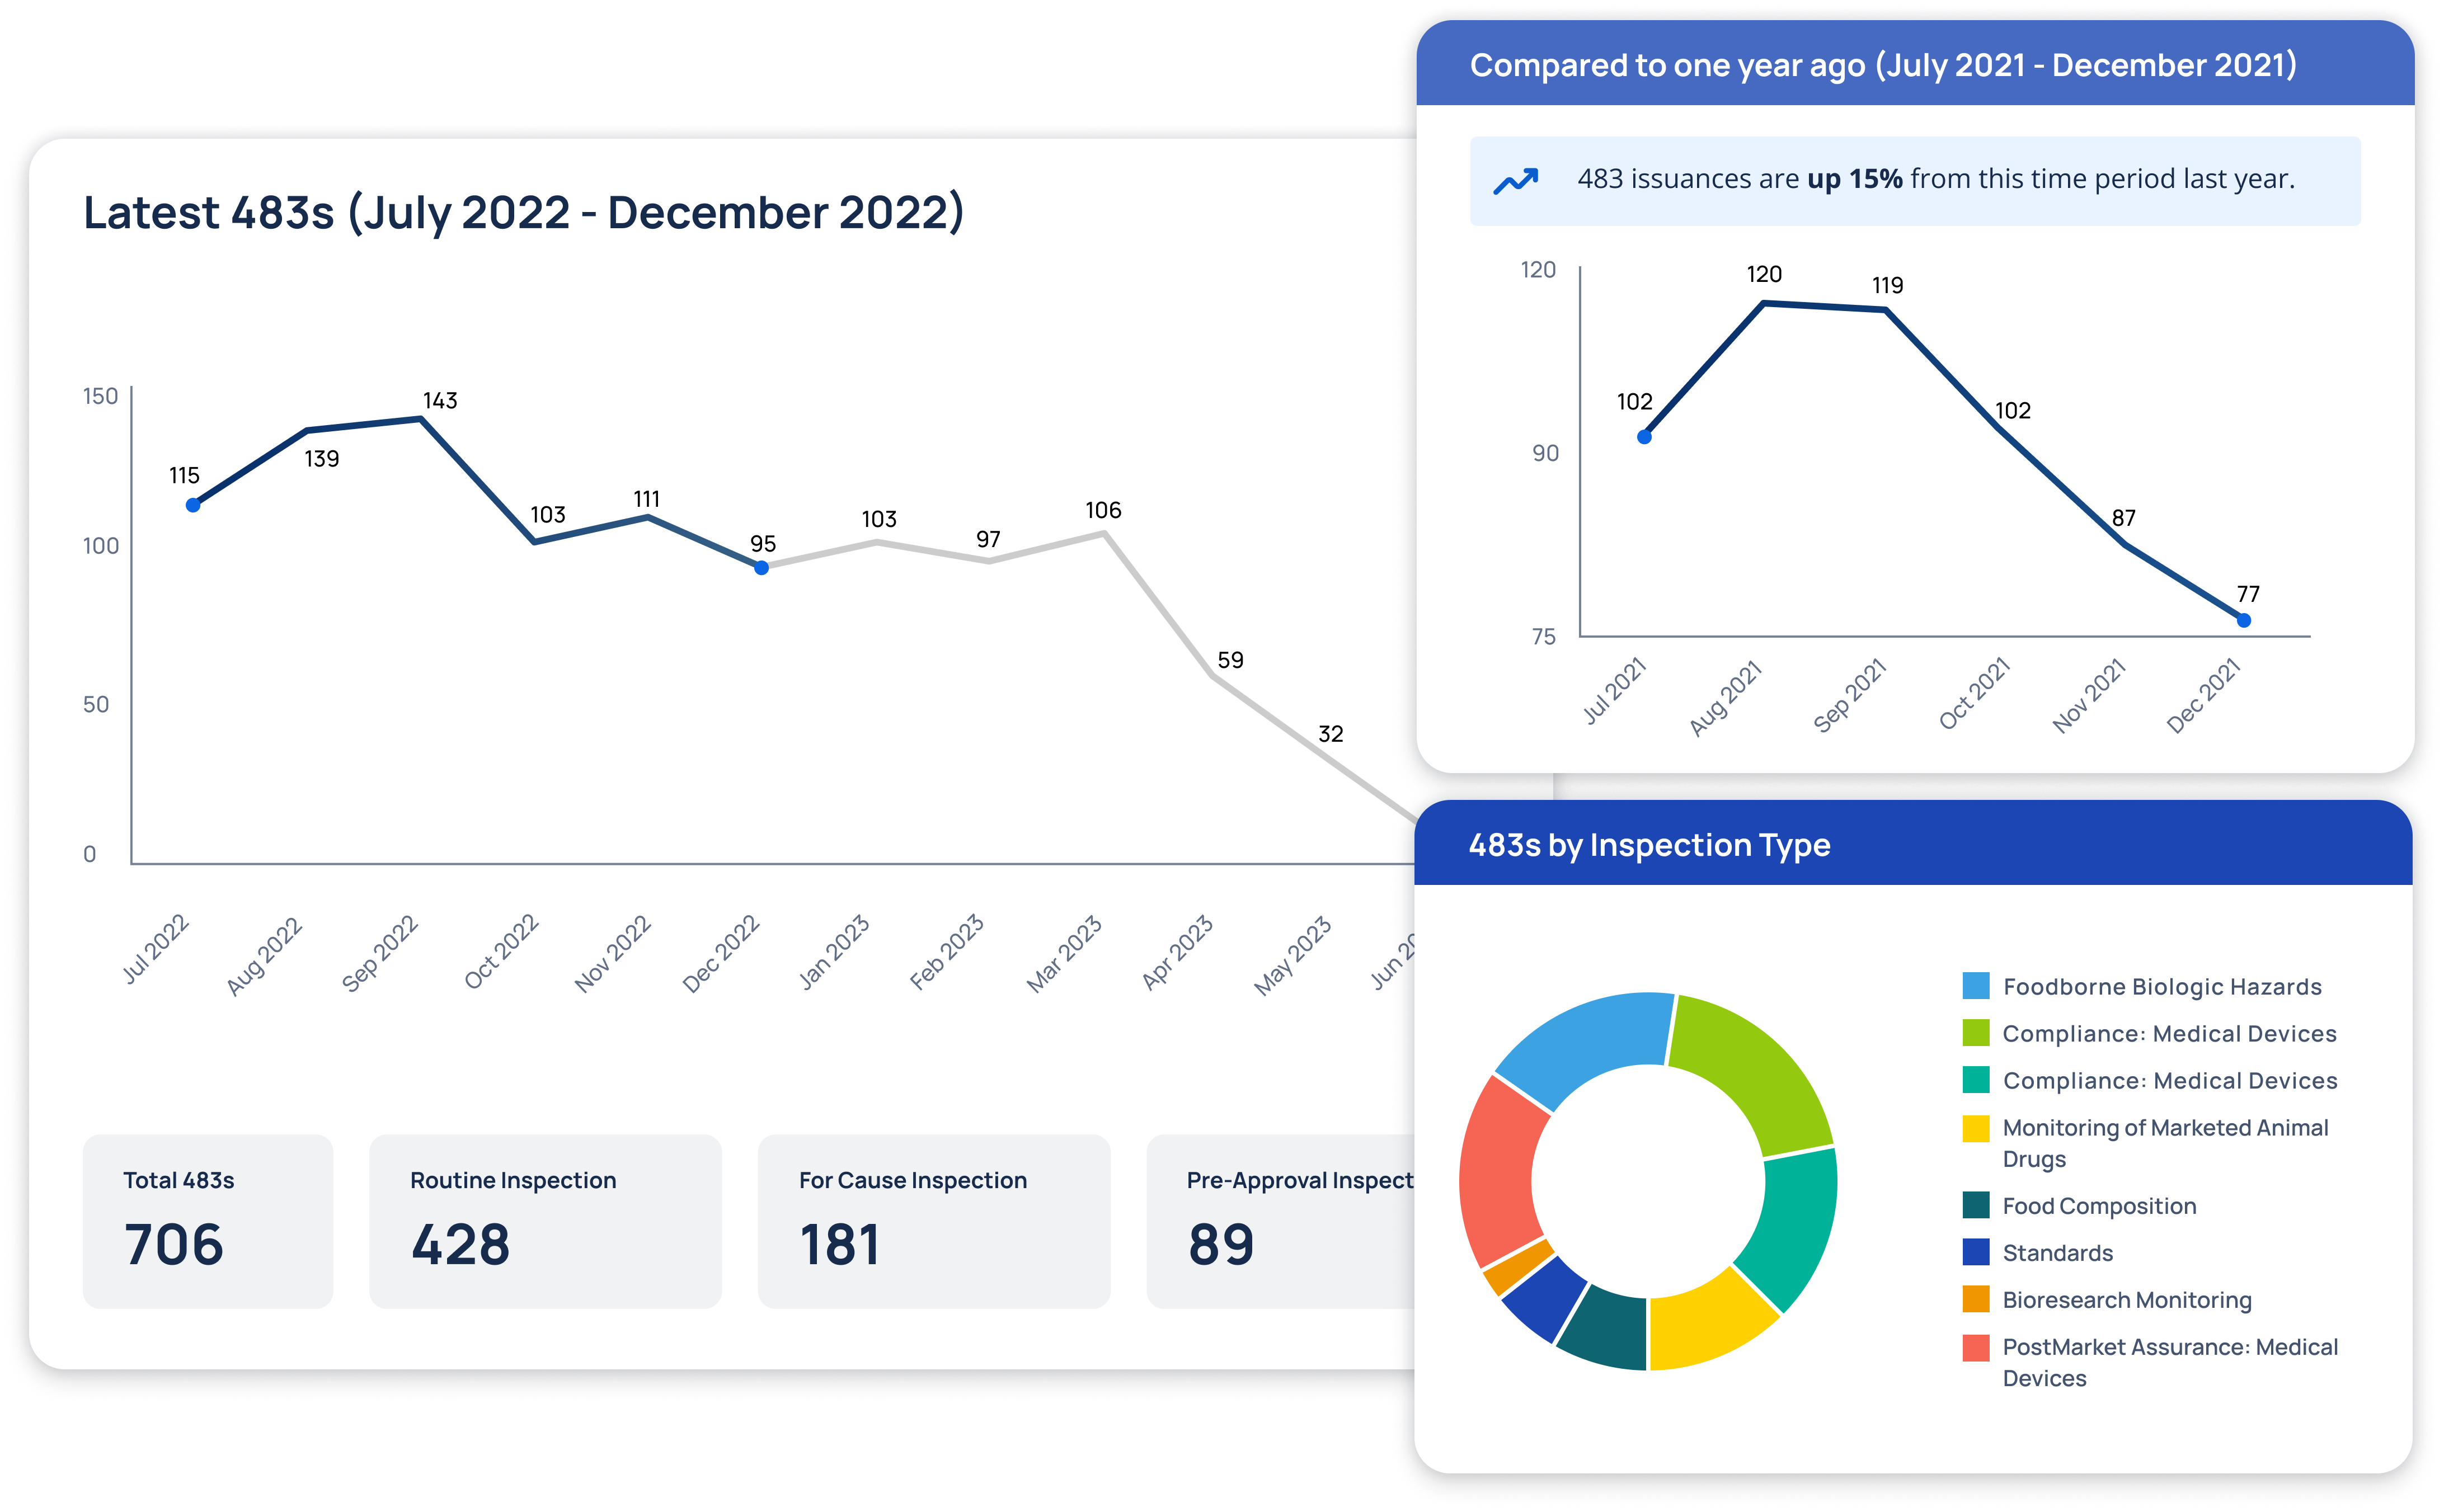
Inspection Trends & Patterns
Advanced analytics revealing inspection patterns, compliance trends, and predictive risk indicators